Form page structure
How does the structure of a form impact time taken, perceived time taken and ease of use.
Read time: 10 mins
Read time: 10 mins
Roles and responsibilities
Senior UX Designer (me) - Discovery, concept ideation, advanced prototyping, card sorting activities, stakeholder management
UX Designer - Discovery, concept ideation, prototyping support
UX Researcher - Conducting moderated testing sessions, Quantitive studies
Senior Product manager - Analytics support
Background
From previous research and also looking at our funnel metrics, it is clear that users often have issues trying to navigate their way through large question sets when completing forms. They lose interest, become bogged down with the amount of data they need to enter or else life gets in the way and they need to drop everything and run!
In this case study we will look at how question sets can be structured and the impact of different structure types on:
As well as looking at time to complete and confidence in the data entered, we wanted this research to really focus on including high and low engagement users, making the question set accessible for people suffering from anxiety or who have been diagnosed autistic or dyslexic.
As a starting point for this project we first looked to the significant body of research the GDS (Government design system) have carried out on question sets and online forms. The research carried out by GDS recommends that you should always start designing a question set using a “One thing per page” format. While only having one question on each page may seem time consuming, starting with one thing on a page helps people to:
Understand what you’re asking them to do
Focus on the specific question and its answer
Find their way through an unfamiliar process
Use the service on a mobile device
Recover easily from form errors
From previous testing on another question set, we observed a 5.5% uplift in users completing a question set when it was formatted in a “One thing per page” style. The caveat to this was that this form only had 10 questions so it was very manageable when answering one thing at a time. What we wanted to know was how does this format translate across to our longer question sets, the longest of which has at least 66 questions.
From previous testing on another question set, we observed a 5.5% uplift in users completing a question set when it was formatted in a “One thing per page” style. The caveat to this was that this form only had 10 questions so it was very manageable when answering one thing at a time. What we wanted to know was how does this format translate across to our longer question sets, the longest of which has at least 66 questions.
Qualitative testing
For our first round of testing, we wanted to test three different page structures with the longest question set. The three formats we tested were:
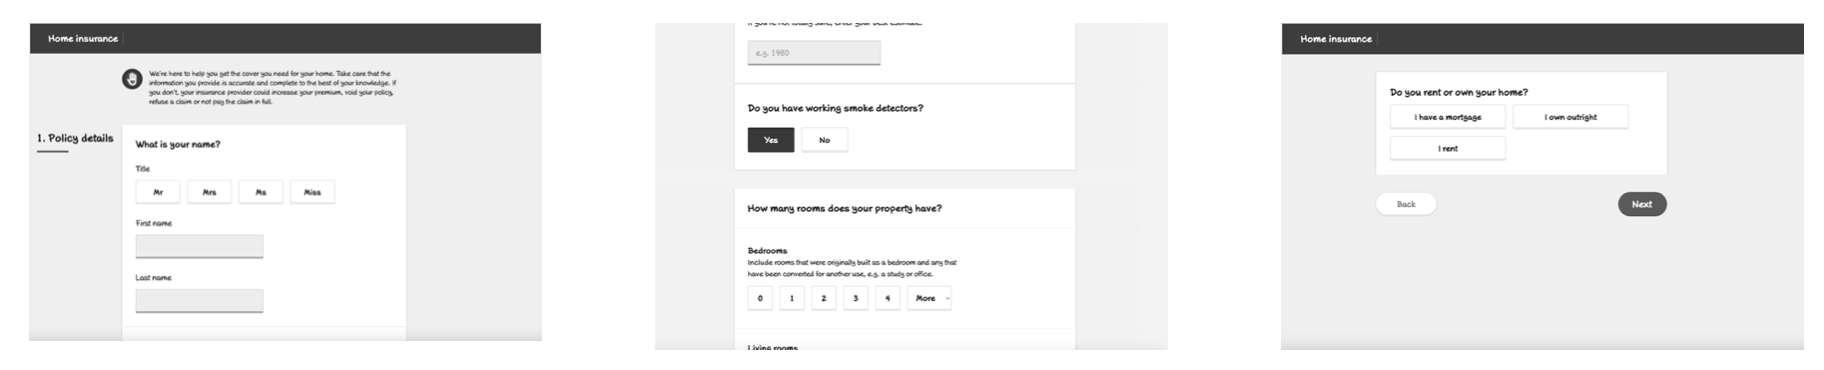
1. All questions on 4 different pages, grouped in logical sections
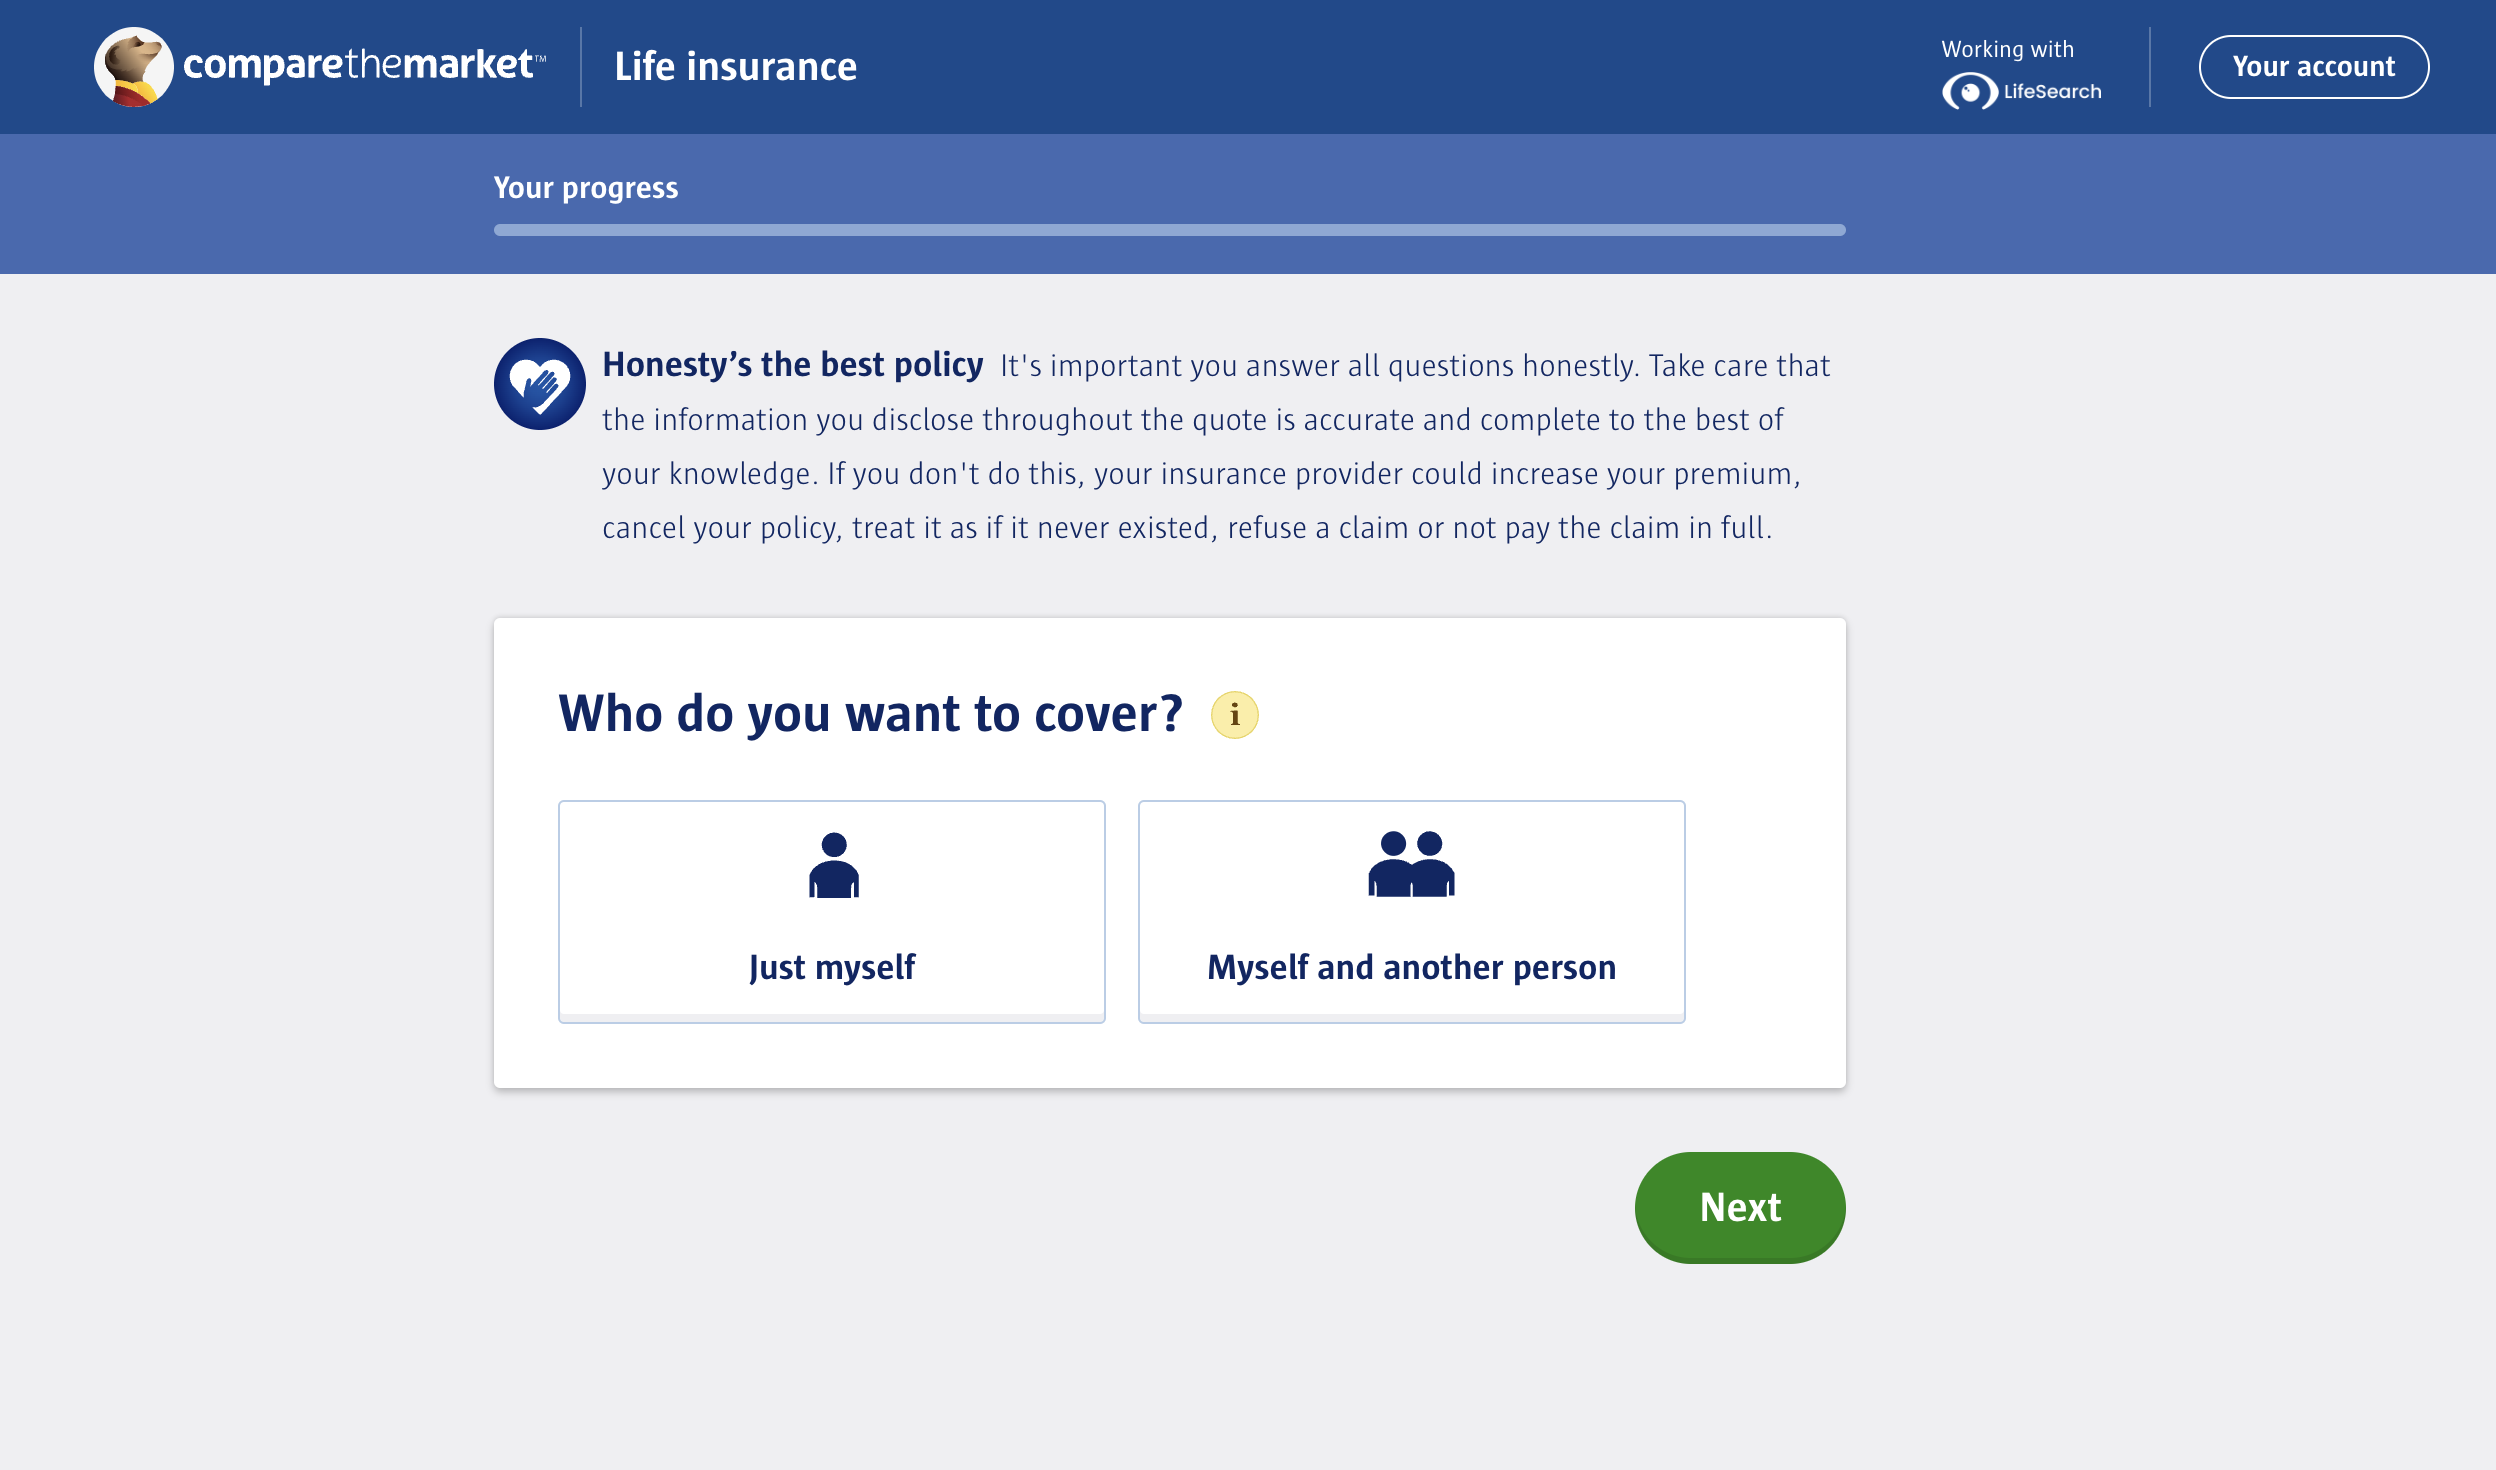
2. One question per page
3. Progressive reveal - All questions on one page, with each section revealing after completing the last
Our hypothesis before testing was that one question per page would be perceived as the least favourable, with progressive reveal and the 4 sections prototypes being more favourable due to the length of the question set.
To test out these assumptions we ran 20 one and a half-hour sessions over 5 days, with a 50:50 split between mobile and desktop. The participants were a mix of high and low engagement users, some of which had been diagnosed with autism, dyslexia and anxiety. The participants were shown two of the three prototypes in alternating orders.
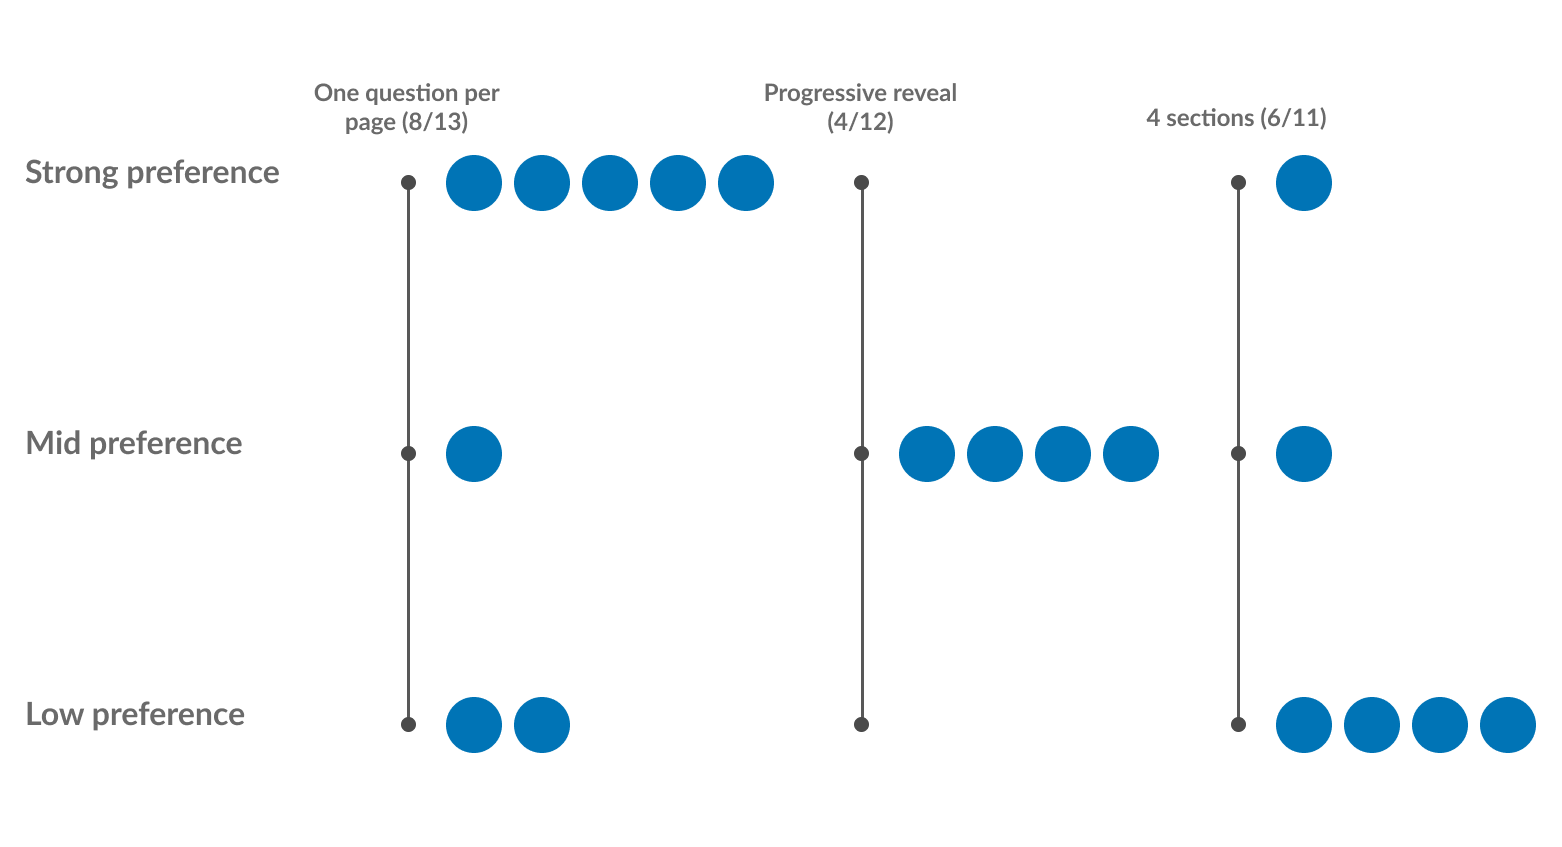
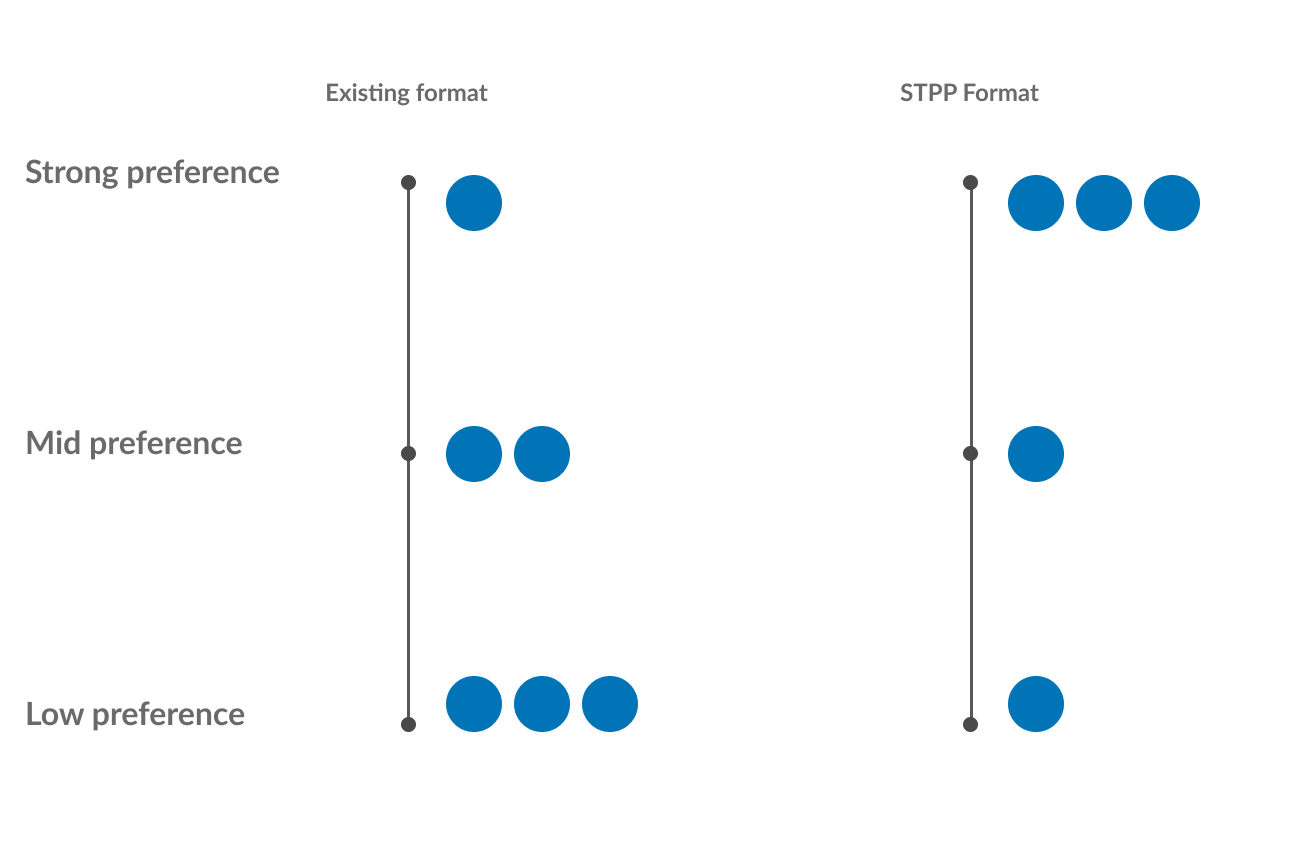
After users had navigated through two prototypes they were asked a series of questions about the forms they went through. The answers to these questions were used to deduce wether a user had a low, mid or strong preference towards any of the three prototypes.
The 4 sections prototype, we found that 6/11 users who saw it had a preference for this prototype. These preferences were mostly low (4) with mid (1) and strong (1) preferences less common.
Progressive reveal was preferred by 4/12 users who saw it, all of which had a mid preference for it.
One question per page was preferred by 8/13 users who saw it. The majority having a strong preference (5) and lesser having mid (1) and low (2) preference for this prototype.
When pressed on how important time taken to complete was in the process, users talked about how accuracy of the information was often more important to them than time to complete.
Quantitative testing
After the first round of qual testing, we ran a larger quant study with ~150 users (50:50 mobile/desktop) for each prototype. This study was more focused on time taken and perceived time taken. Secondary questions around ease of use and understanding of questions were also asked.
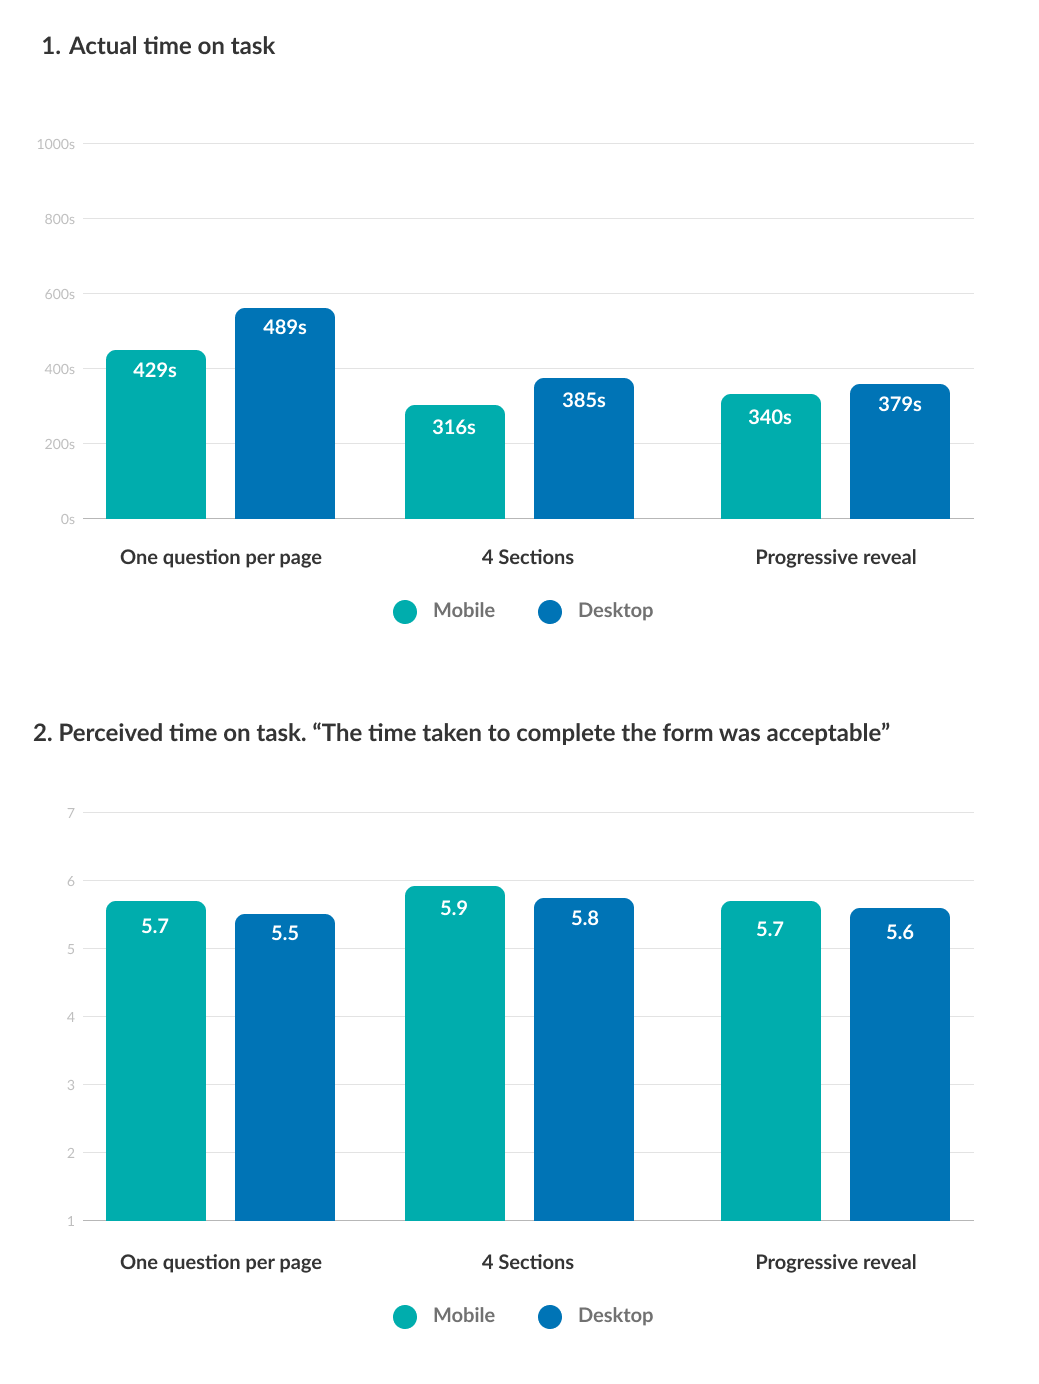
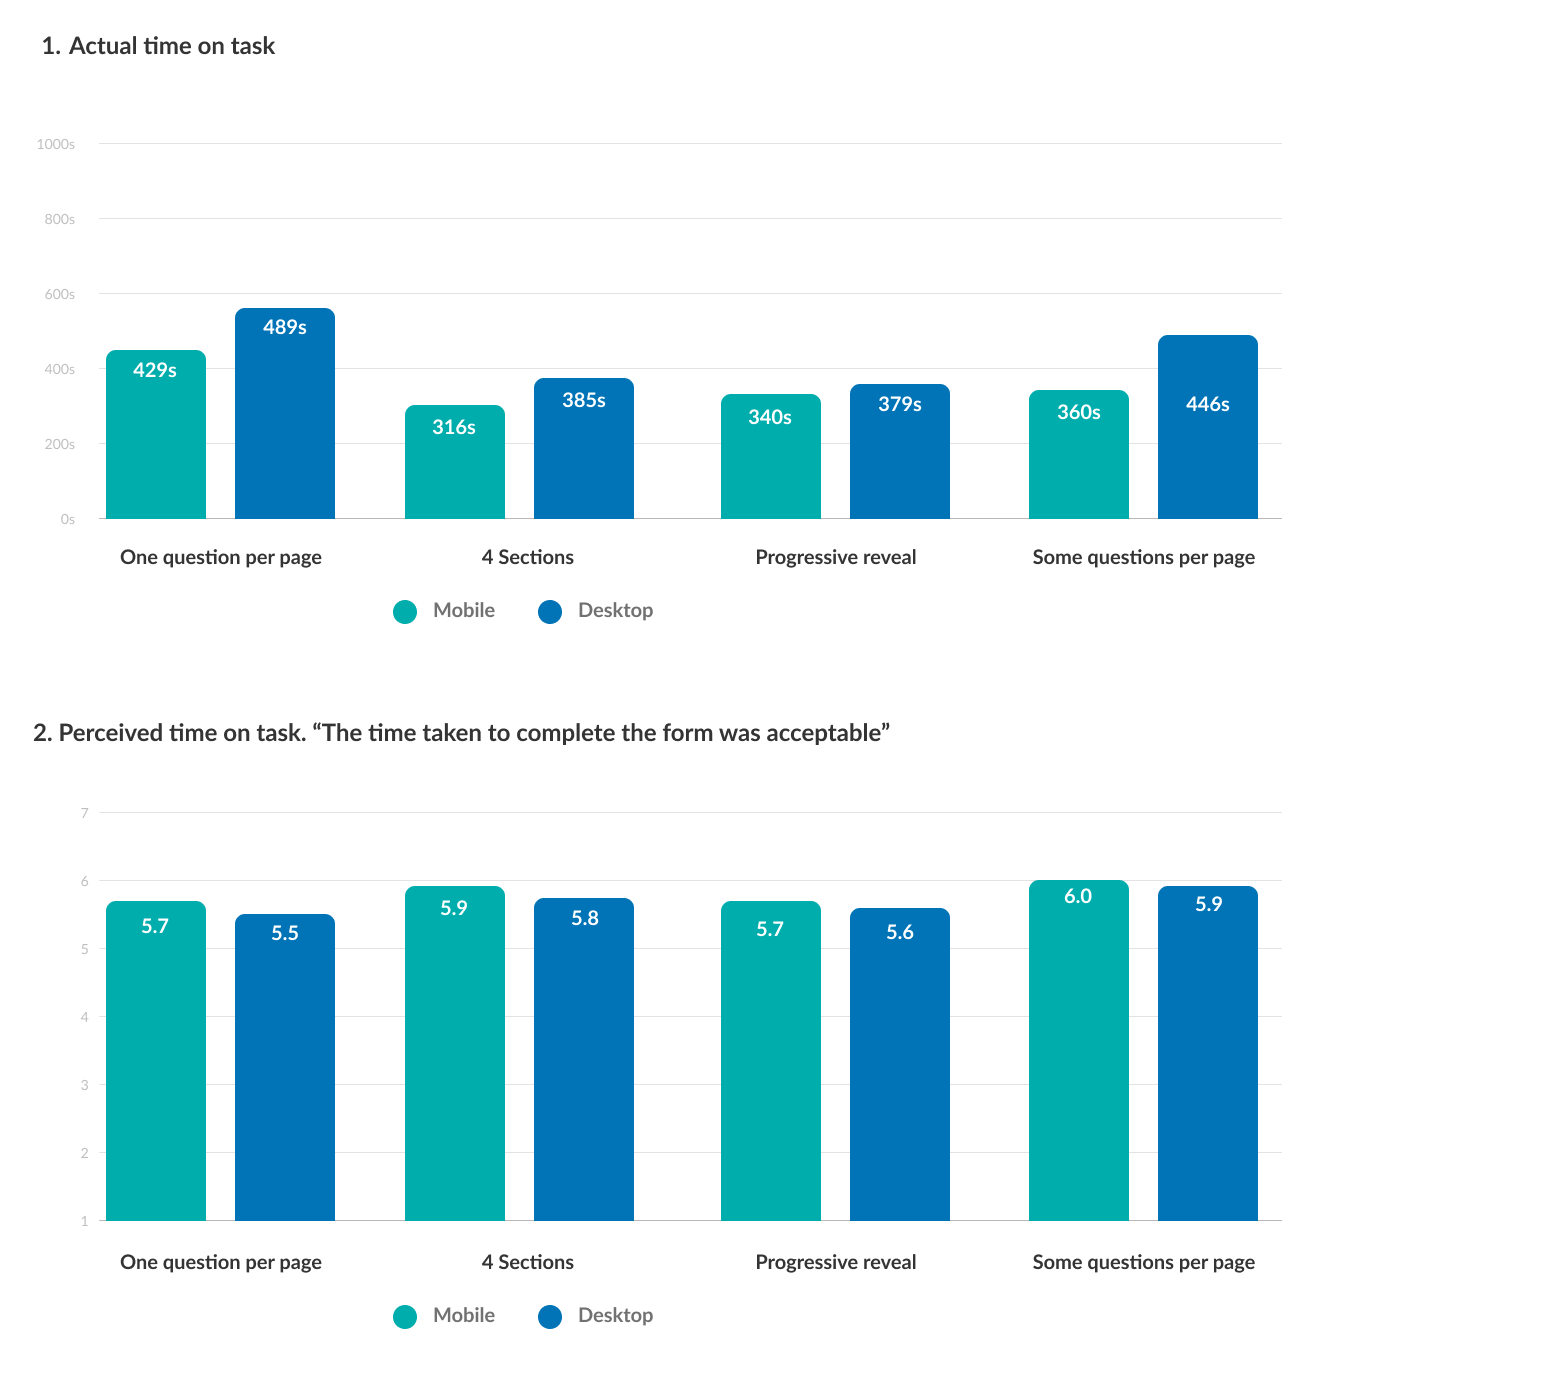
What we found for actual time taken to complete was as expected. One question per page took longest (~450 seconds), with the 4 section structure (~350 seconds) and progressive reveal (~350 seconds) taking less time.
After the task the users were asked to rank on a scale of 1-7 if they strongly disagree (1) or strongly agree (7) with the statement “The time taken to complete the form was acceptable”. We saw very little in the differences between the three prototypes.
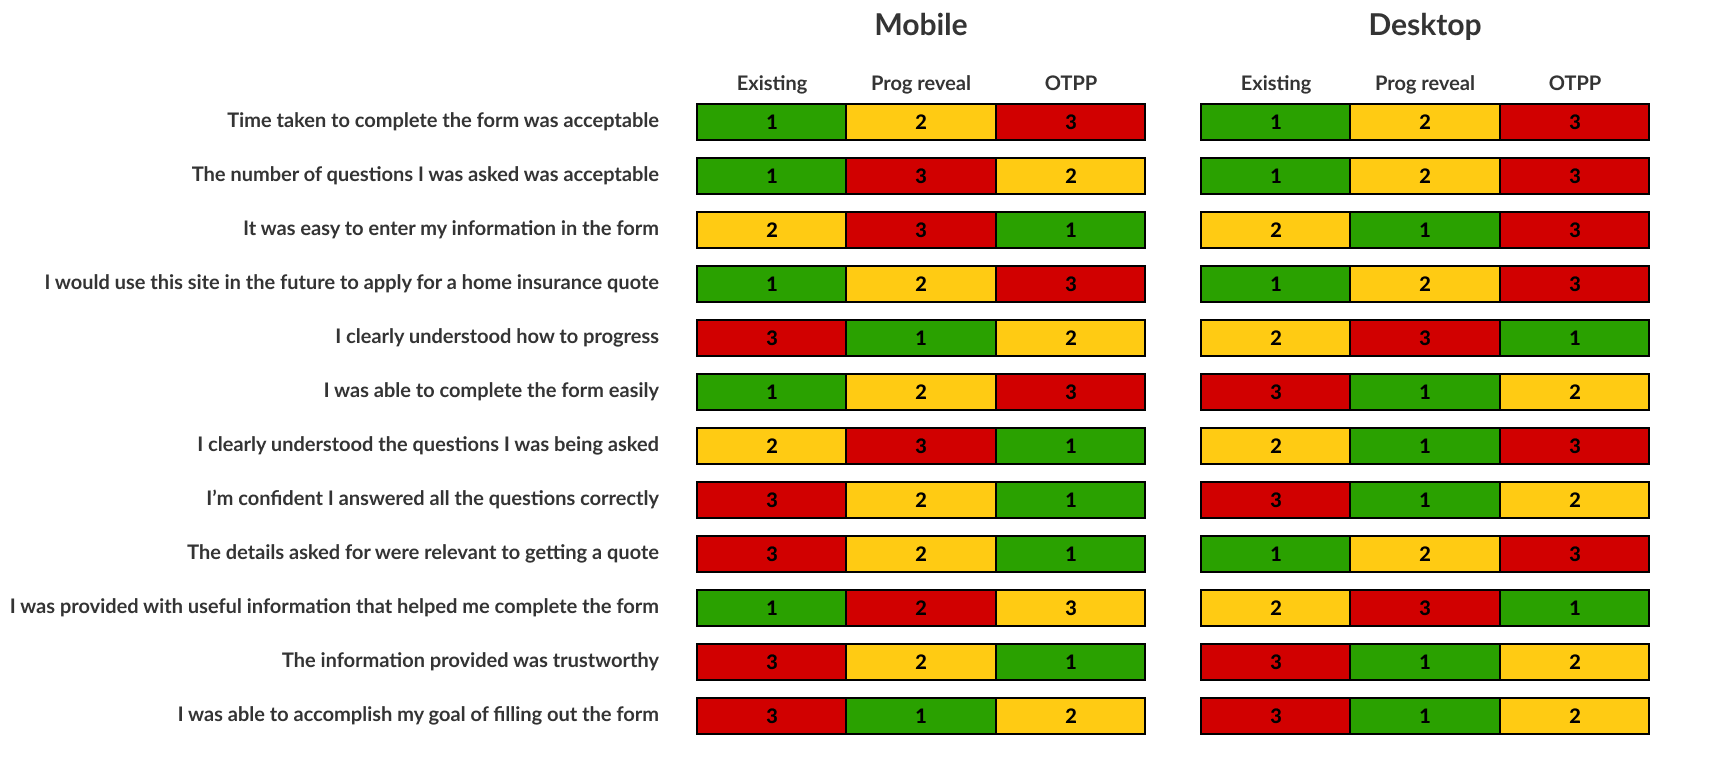
Users in the quant test were also asked to rate 12 different aspects of the journey in total, some focused on ease of use and some focused on their confidence around the information they had entered. There was no massive difference between scores, we then ranked them in a winners/losers style to see if there were any noticeable trends.
What we noticed is that there was no clear trend towards any of the three prototypes, but we did see on mobile that the One thing per page prototype performed best when it came to the confidence each user had when entering information. This was aligned with what we expected to see from this prototype.
What we noticed is that there was no clear trend towards any of the three prototypes, but we did see on mobile that the One thing per page prototype performed best when it came to the confidence each user had when entering information. This was aligned with what we expected to see from this prototype.
“Some questions per page”
For the next iteration of the question set, we wanted to try and retain the benefits of the one question per page structure while not making the process laborious for our high engagement users who were put off by the amount of pages in the question set.
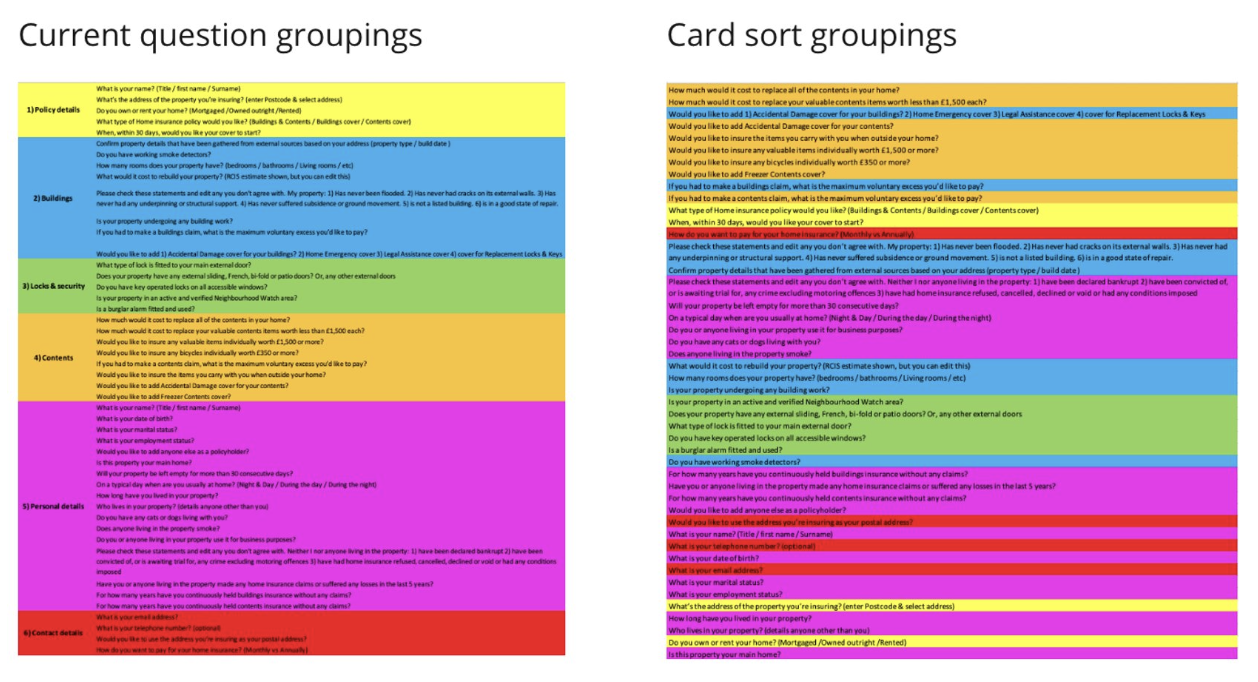
To kick this off we first ran a card sorting exercise with 100 participants. This was an open card sort where the participants were given a list of all the questions in our form and asked to group them in a logical way, using as few or as many groups as they liked. This would give us a high level view on how users grouped questions in our forms.
The next step was to use this card sort and our own understanding of the questions to group the question set in a logical way, but sticking to the rule that we can only have between 1 and 4 questions on each page. If a question is seen as requiring a high level of cognitive effort then we would keep that question on its own page.
Qualitative testing
The new some questions per page designs were tested in 8 one-hour moderated sessions over 3 days. Again we had a 50:50 split between mobile and desktop. The participants were a mix of high and low engagement users, some of which had been diagnosed with autism, dyslexia and anxiety. All the users were shown the new some questions per page question set only.
Link to advanced prototype example - Some Questions Per Page Desktop
During this test, one of the key metrics we wanted to focus on was the perceived time to complete the form. After the users had navigated through the form they were asked if they felt the process was longer than expected, as expected or quicker than expected based on their previous experiences with this form. Of the 8 participants, 4 users said they felt the process was quicker than expected, 3 said it was as expected and one said the process felt longer than expected.
Of the 8 users tested, nobody commented on the amount of times they had to click to move on to the next page (One question per page had 66 pages and some questions per page was cut down to 24 pages).
Quantitative testing
To get a comparison view of how the new some questions per page format was performing against the previous iterations we conducted another large scale quantitative test. We recruited 162 participants (76 mobile and 86 desktop) to go through the prototype and we again looked at time on task and perceived time on task.
For some questions per page we found that we significantly reduced the actual time on task (360s mobile and 446s desktop) from the one question per page iteration (429s mobile and 489s desktop). This brought the new version more in line with the 4 sections and progressive reveal structures.
We also saw an increase in how strongly users agreed that the time taken to complete the form was acceptable (6/7 mobile 5.9/7 desktop) against its one question per page counterpart (5.7/7 mobile and 5.5/7 desktop).
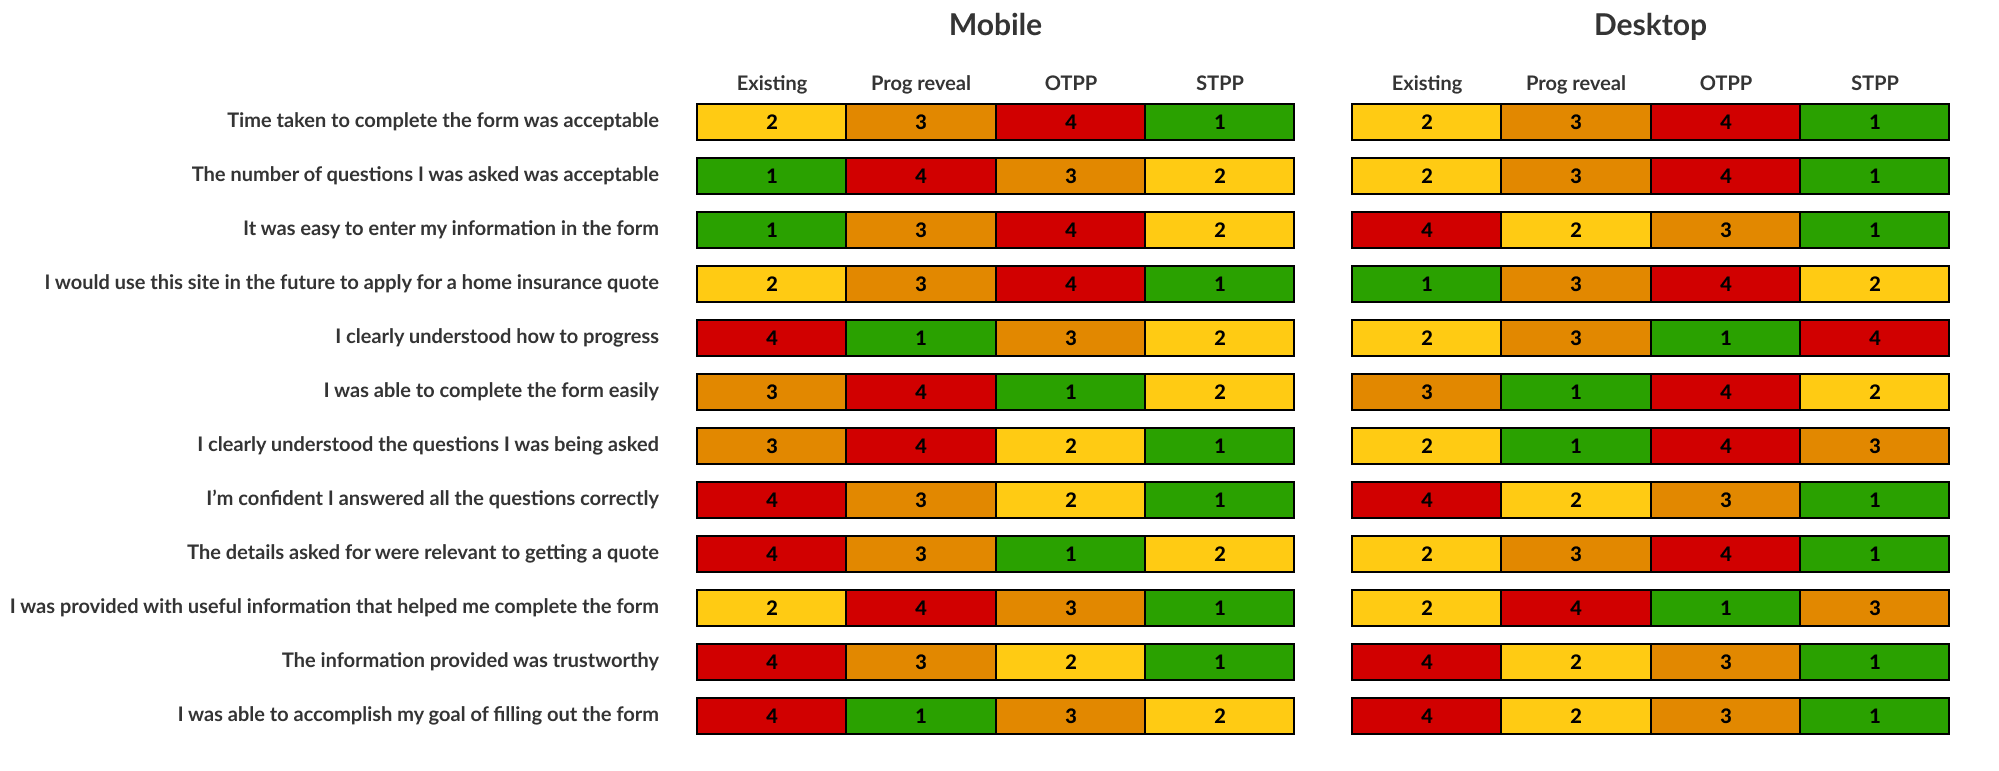
Again, users in the quant test were asked to rate 12 different aspects and these scores were compared against the scores from the earlier quant test.
The scores between each of the different criteria across the four prototypes were very small, but when ranked in a winners and losers style scale you can clearly see there is a preference towards the STPP layout on both mobile and desktop.
The scores between each of the different criteria across the four prototypes were very small, but when ranked in a winners and losers style scale you can clearly see there is a preference towards the STPP layout on both mobile and desktop.
RNIB consultation
Alongside this research, we also held a consultation session with some usability experts from RNIB (Royal National Institute of Blind People) and presented the four different form page structure.
The conclusion after seeing each of the prototypes was that One question per page was the preferred format for assistive technology. This was due to the limitation of errors that may present on a page as well as ease of use in how to fix these errors. It was however accepted that in situations where one question per page may not be possible. The approach we have taken with some questions per page is the best compromise and still desirable from an accessibility point of view.
Business imapact
The impact of this piece of work is still unknown as the designs are being rolled out iteratively over the next 12 months. As we release each section of the journey we will be tracking some KPI's such as drop off, number of users interacting with help and ultimately click through to purchase. Because this is such a big change to our biggest product, and because we are completely changing the design system along with it, it was decided to release slowly so we can assess the impact of all the changes on our users behaviour.
Aside from conversion metrics, what we have successfully done in this project was to design an accessible form filling experience for all of our customers which will now crucially include our most vunerable customers. Our new design system meets WCAG level 2.1 AA standard as required by the FCA and our quote journey we feel meets the same standards for usability.